


Next: Experiment 2: Human Dermal
Up: Experimental Validation of the
Previous: Experimental Validation of the
MATERIALS AND METHODS
The cells were derived from a sample of bovine auricular cartilage.
The cells were in a T75 flask and the medium was aspirated. Phosphate buffered
saline (2ml) was added and removed. Trypsin EDTA (2ml) was added to break up
the extracellular matrix. 10ml of cell medium was added to the flask.
The cell medium is RP. MI Mefium 1640 with fetal bovine
serum, L-glutaime, mem-amino acids, and penicillin-streptomycin additives were added.
The tube with solution was centrifuged at 1500 rpm for 5 minutes. The soultion was aspirated and 40 ml of fresh medium was added. One ml was added to each well of three 12-Well Micorplates.
The microplates were labeled Day 1-4, Day 5-8 and Day 9-12, with 3 wells for each day.
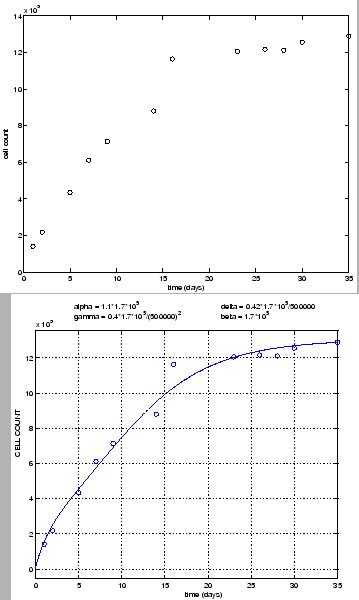
The results of the cell count are shown in the graph on Figure 3.1 left.
Model (2.1)-(2.3) was used to obtain the numerically
calculated cell count and accumulation of ECM. The data from the first 8 days
was used to estimate the parameters in the model. The following values were obtained
 |
(3.1) |
Numerical simulations using MATLAB were obtained to predict the dynamics of the cell and ECM
concentrations.
RESULTS
Figure 3.1 right shows the numerically calculated cell count
superimposed over the experimental data, shown in circles.
The figure shows excellent agreement between the model and experiment.
Figure:
The figure on the left shows
cell count over 35 days in the experiment
using auricular bovine chondrocytes.
The figure on the right shows the numerically calculated cell count
(solid line) using our model (2.1)-(2.3),
superimposed over the experimental data (circles).
 |
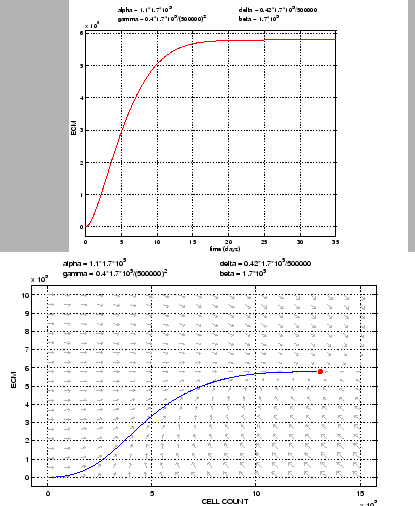
In Figure 3.2 left we show
the dynamics of the accumulation of the extracellular matrix over 35 days.
Figure 3.2 right shows the phase-space portrait
and the solution trajectory over the time interval from 0 to 35 days.
The red dot corresponds to the steady state (equilibrium), indicating that
the value of  and
and  at 35 days is close to the equilibrium.
Figure:
The figure on the left shows the accumulation of the ECM over 35 days,
predicted by our mathematical model. The figure on the right shows
the phase space portrait of the system (2.1)-(2.3).
The arrows show the vector-field determined by  and the
curve shows that solution trajectory starting at the initial point
determined by the experimental data. The (red) dot shows the
steady state (equilibrium).
and the
curve shows that solution trajectory starting at the initial point
determined by the experimental data. The (red) dot shows the
steady state (equilibrium).
 |
Next: Experiment 2: Human Dermal
Up: Experimental Validation of the
Previous: Experimental Validation of the
Suncica Canic
2007-04-18