


Next: Conclusion
Up: Experimental Validation of the
Previous: Experiment 1: Bovine Auricular
MATERIALS AND METHODS
TODO:Doreen
RESULTS
We used our model (2.1)-(2.3) to estimate the parameters
corresponding to the growth of human dermal fibroblasts on two different
artificial surfaces.
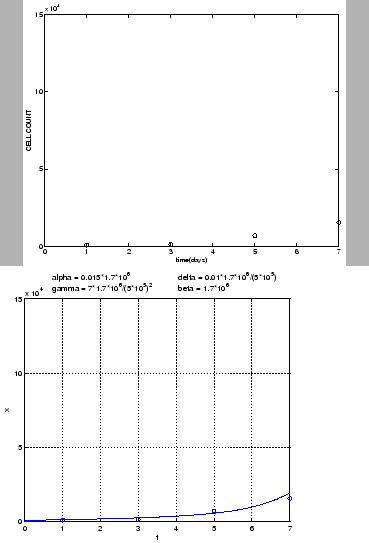
The set of parameters corresponding to the low proliferation rate on the
tc treated polystyrene is
 |
(3.2) |
Figure 3.3 left shows the experimental data (cell count) over
7 days. Figure 3.3 right shows the numerically calculated
cell count superimposed over the experimental data. Again, excellent agreement
was obtained.
Figure 3.3:
The figure on the left show the cell count of human dermal fibroblasts
seeded on the tc treated polystyrene. The figure on the right
shows the numerically calculated solution (solid curve) to our model,
showing the cell count in seven days, superimposed over the experimental data
(shown in circles).
 |
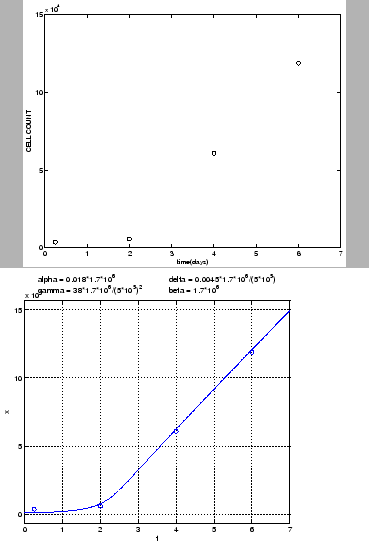
The set of parameters in our model (2.1)-(2.3)
corresponding to the high proliferation rate obtained
for human dermal fibroblasts grown on the aluminum foil is
 |
(3.3) |
Figure 3.4 shows the experimentally obtained cell count and
the numerically calculated approximation of the cell count, showing excellent agreement.
Figure 3.4:
The figure on the left show the cell count of human dermal fibroblasts
seeded on the aluminum foil. The figure on the right
shows the numerically calculated solution (solid curve) to our model,
showing the cell count in seven days, superimposed over the experimental data
(shown in circles).
 |
Notice that the parameter  in this model is predominantly determined
by the cell type, and not by the type of the artificial surface used
as base for the cell culture. To capture the proliferation rate of the same
cell culture on different artificial surfaces, the coefficients
in this model is predominantly determined
by the cell type, and not by the type of the artificial surface used
as base for the cell culture. To capture the proliferation rate of the same
cell culture on different artificial surfaces, the coefficients
 and
and  play the leading role. The higher the quotient
 the higher the proliferation rate on a given surface.
Next: Conclusion
Up: Experimental Validation of the
Previous: Experiment 1: Bovine Auricular
Suncica Canic
2007-04-18